 |
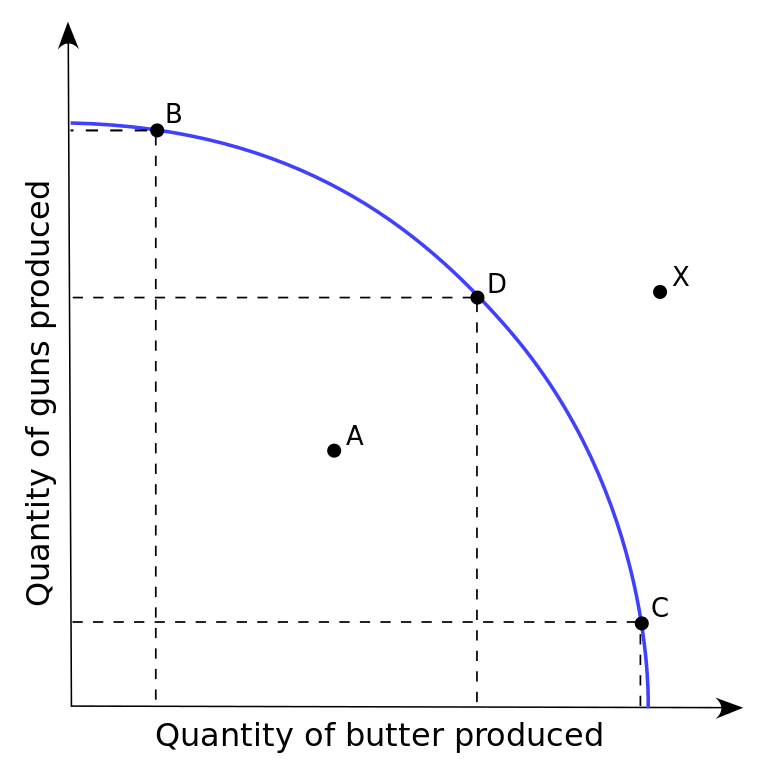
| B, D, C - Attainable and efficient A - Attainable yet inefficient (underutilization) X - Unattainable in current state |
Also known as the PPC, PPF, or PPG
The PPC shows alt. ways of resource usage
4 Assumptions
- 2 goods
- Fixed resources
- Fixed technology
- Full employment of resources
Efficiency
- Efficiency - Max usage of resources; little wasted
- Allocative - Products produced most desired by society
- Productive - Products produced w/ least cost; any point on curve
- Underutilization - Using fewer resources than economy's capability
Movements of the PPC
- Inside PPC - when resources are unemployed
- Along PPC - on curve
- Shifts of PPC
- Increase - graph moves ->
- Decrease - graph moves <-
Causes of Shift
- Tech change (Out)
- Resource change (Out)
- Economic growth
- Natural disasters/war/famine (In)
- Labor change (In)
- Increase in education & training (Human capital) (In)
This comment has been removed by the author.
ReplyDeleteTo be honest in the real world of economics, this is highly unrealistic, but it allows us to better understand opportunity costs, trade-offs, and maximization/utilization.
ReplyDelete