Thursday, March 3, 2016

Investment Demand


  • Investment - $ spent/expenditures on new plants/factories, capital equipment, technology, new homes, inventory.

Expected Rates of Return

  • Invest based on cost/benefit analysis
  • Benefits from expected rate of return
  • Cost from interest costs
  • Amount of investment from comparison of expected rate of return to interest cost
    • Exp return > Interest Cost = Yes
    • Exp return < Interest Cost = No
  • r% vs. i%
    • Nominal = observable rate of interest; Real takes out inflation, known ex post facto
    • r% = i% - pi% -> bases investment decision
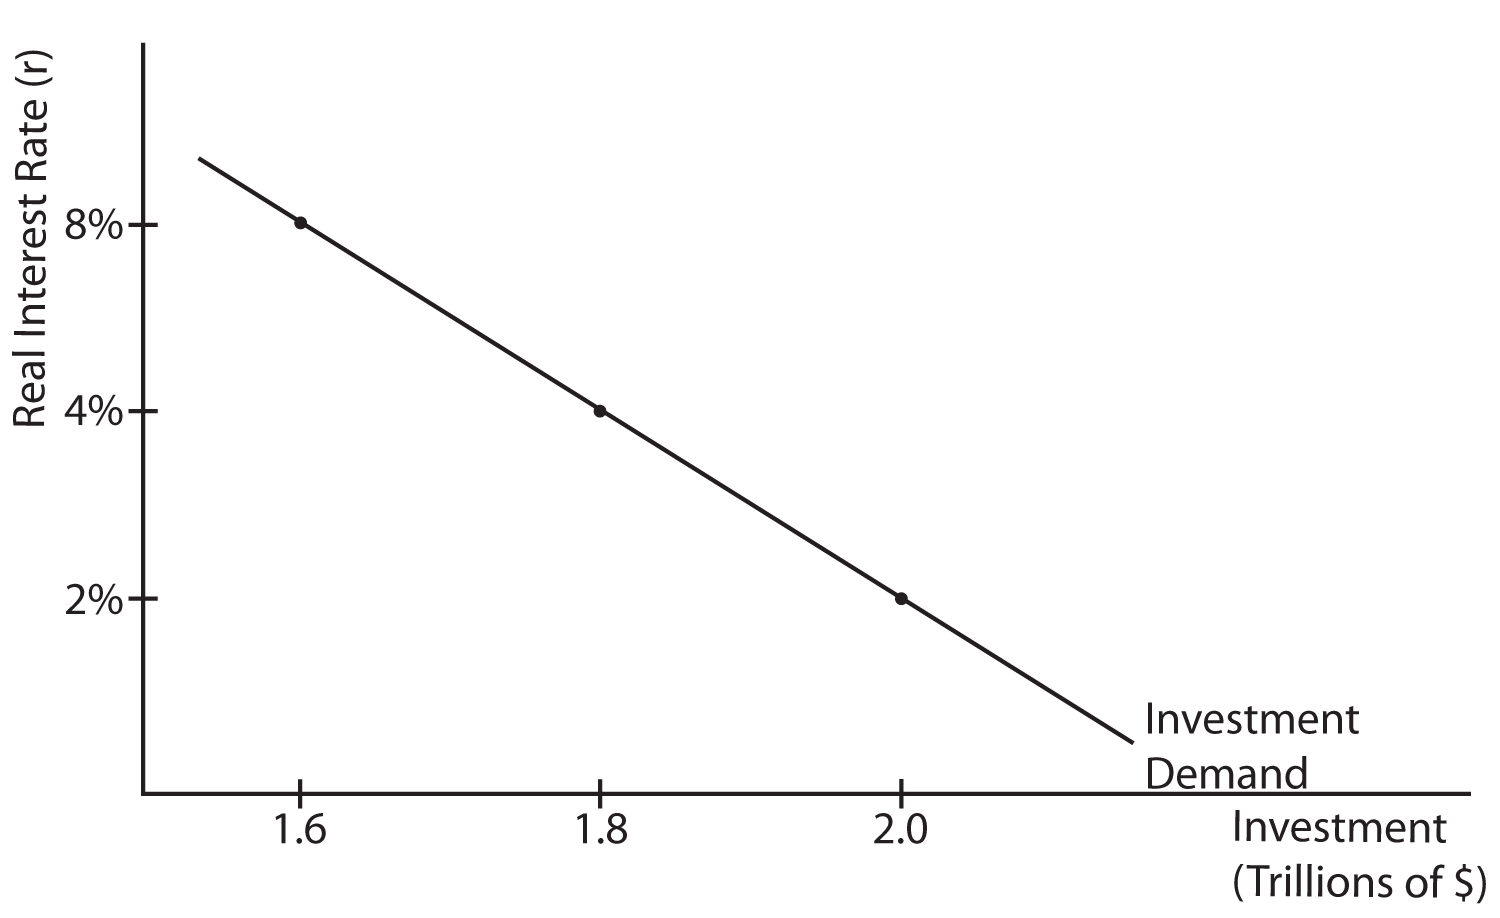
The Curve

  • Downward sloping because high rates = less investment, vice versa
  • Shifts 
    • Cost of production 
      • Low = right
      • High = left
    • Business Taxes
      • Low = right
      • High = left
    • Tech Change
      • New = right
      • Lacking = Left
    • Stock of Capital
      • Low = right
      • High = Left
    • Expextations
      • Positive = right
      • Negative = left
Image 6.07. This graph is placed depicts the X axis as Investment (Trillions of Dollars). The second graph's Y axis is labeled as Real Interest Rate (r). There are three labeled values on the X axis and three labeled values on the Y axis. On the X axis, the closest value to the origin is labeled 1.6. The value to the right of the first is labeled 1.8. The third value, which is farthest from the origin, is labeled 2.0. On the Y axis, the closest value to the origin is labeled 2%. The second value, which is located above the first, is labeled 4%. The third value, which is the farthest from the origin, is labeled 8%. A line with a decreasing slope is labeled Investment Demand. This line has three specific coordinates, which are (1.6, 8%), (1.8, 4%), and (2.0, 2%).

No comments:

Post a Comment