Unit 5
- SRAS - Wages fixed as $ fluctuates
- LRAS - Wages responsive to ∆ in PL
- Effects - SR - > PL ∆ allow firm to exceed normal outputs and labor since profits up
- LR -> Wages adjust to PL; previous output levels follow.
- Extended Model - Both SRAS and LRAS; LRAS vertical @ full employment
Inflation
- Demand-pull - Price up based on AD (Right)
- SR - $ up, Prod. up
- LR - AD increases subside
- Cost-push - Left, inc. in per unit costs (up in res. $); Cause of PL increase
- Gov. dilemma
- Wait - Recession (Prod. and Employ. down)
- Action - Inflationary Spiral
Phillips Curve
- Long Run Phillips Curve - Vert @ natural rate of unemployment
- Struc changes in Un also shifts LRPC
- Inc in Un LRPC ->
- Dec in Un LRPC <-
- No trade off b/t inflation and unemployment
- Occurs at Un; Rep by up or down
- Assumption - More worker benefits create higher natural rates vice versa for less
- Short Run Phillips Curve - Tradeoff b/t inflation and unemployment
- Supply Shocks - Rapid and significant increase in resource cost (SRAS left; SRPC right)
- Misery Index - Combo of inflation and unemployment in any given year. 0-9 good
- Inflation - General rise in PL
- Deflation - General decline in PL
- Disinflation - Decrease in rate of inflation over time
- Stagflation - Inflation and unemployment increase @ same time
Reaganomics
- ∆ in AS, not AD -> Determines inflation level, unemployment rates, and econ. growth
- Supply side economics support policies that promote GDP growth by arguing that high marginal tax rates along with current system of transfer payments (unemployment comp or welfare program) provide disincentives to work invest, innovate, and undertake entrepreneur ventures
- Low marginal tax rates induce more work -> AS up
- Leisure more costly, work more attractive
- Incentives to save and invest
- High marginal tax rates reduce rewards for saving and investment
- Consumption might increase; investment depends on savings
- Lower marginal rates encourage saving and investing
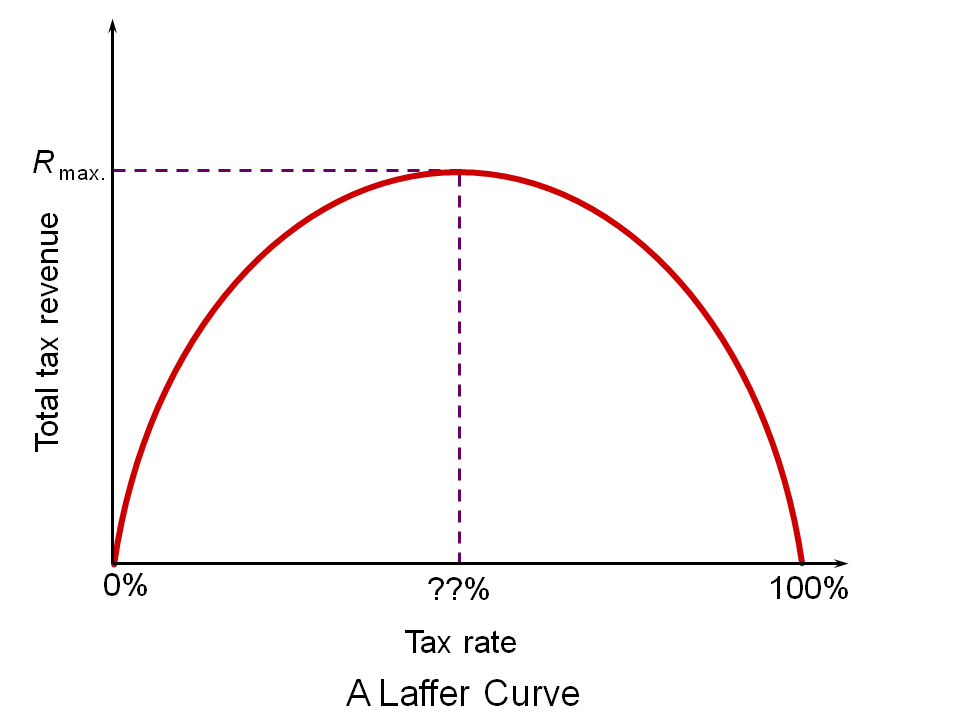
- Laffer Curve - Theoretical relationship b/t tax rates and gov revenue
- As tax rates increase from 0, tax revenues increase from 0 to some max point and then decline
- Criticisms
- Research suggests impact of tax rates on incentives to work, save, and invest are small
- Tax cuts increase demand -> fuel inflation and demand can exceed supply
- Economy's real location on curve difficult to determine


As you have already stated, the LRPC is vertical at the natural rate of unemployment. However, do not forget that that standard unemployment rate is 4-5%. Furthermore, remember that the NRU can be calculated using the following equation:
ReplyDeleteNRU= Frictional + Structural+ Seasonal Unemployment